
~2 min read • Updated Dec 15, 2025
Technical Analysis of Bitcoin (BTC/USDT) on the 1-Hour Timeframe – August 18
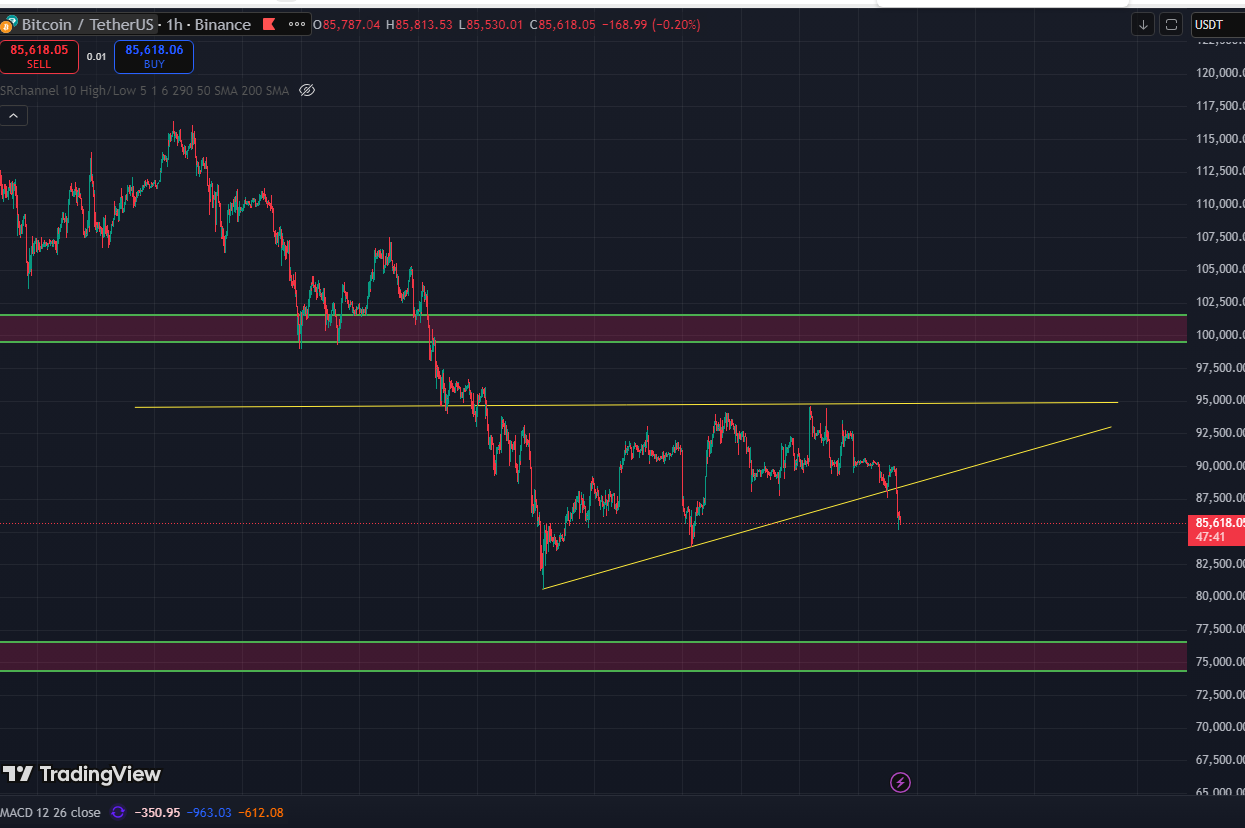
Problem Statement:
On the 1-hour BTC/USDT chart, Bitcoin is trading at $85,618.05 with a slight decline of 0.20%. A yellow ascending triangle has just broken downward, and the MACD indicator shows strong bearish momentum. This analysis aims to identify optimal entry and exit points based on these signals.
Ascending Triangle and Bearish Breakout
The ascending triangle pattern recently broke downward, indicating buyer weakness and potential continuation of selling pressure. The key support zone lies near $84,500, and if broken, the next target could be $83,000.
Suggested Strategy: Sell on confirmation below $85,500 with a target of $84,500 and stop-loss above $86,000.
MACD Indicator Status
Current MACD values:
MACD Line: -350.95
Signal Line: -963.03
Histogram: -612.08
These values reflect strong bearish momentum. The wide gap between the MACD and Signal Line suggests a continuation of the downtrend.
Key Price Levels
Based on the price axis:
- Resistance: $87,500 and $89,000
- Support: $85,000, $84,500, and $83,000
If price rebounds and stabilizes above $86,500, a bullish reversal scenario may emerge.
Trading Summary Table
| Trade Type | Entry Point | Target | Stop-Loss |
|---|---|---|---|
| Short-Term Sell | $85,500 | $84,500 | $86,000 |
| Mid-Term Sell | $84,500 | $83,000 | $85,500 |
| Reversal Buy | $86,500 | $87,500 | $85,800 |
Python Code Example for MACD Analysis
You can use the following Python code to analyze Bitcoin’s MACD status using price data:
import pandas as pd
import ta

# Assume df contains Bitcoin closing prices
df['MACD'] = ta.trend.macd_diff(df['Close'])
df['Signal'] = ta.trend.macd_signal(df['Close'])

# Sell signal when MACD is below the signal line
df['Sell_Signal'] = df['MACD'] < df['Signal']
This signal helps identify bearish momentum and potential exit points.
Conclusion
Given the bearish breakout from the ascending triangle and negative MACD readings, Bitcoin shows selling pressure on the 1-hour chart. Traders should monitor support zones closely and consider sell setups unless price stabilizes above key resistance. Momentum indicators can improve timing and risk control.
Written & researched by Dr. Shahin Siami