
~4 min read • Updated Feb 15, 2026
Technical Analysis of Gold (XAU/USD) – H1 Timeframe – February 13, 2026
Analysis:
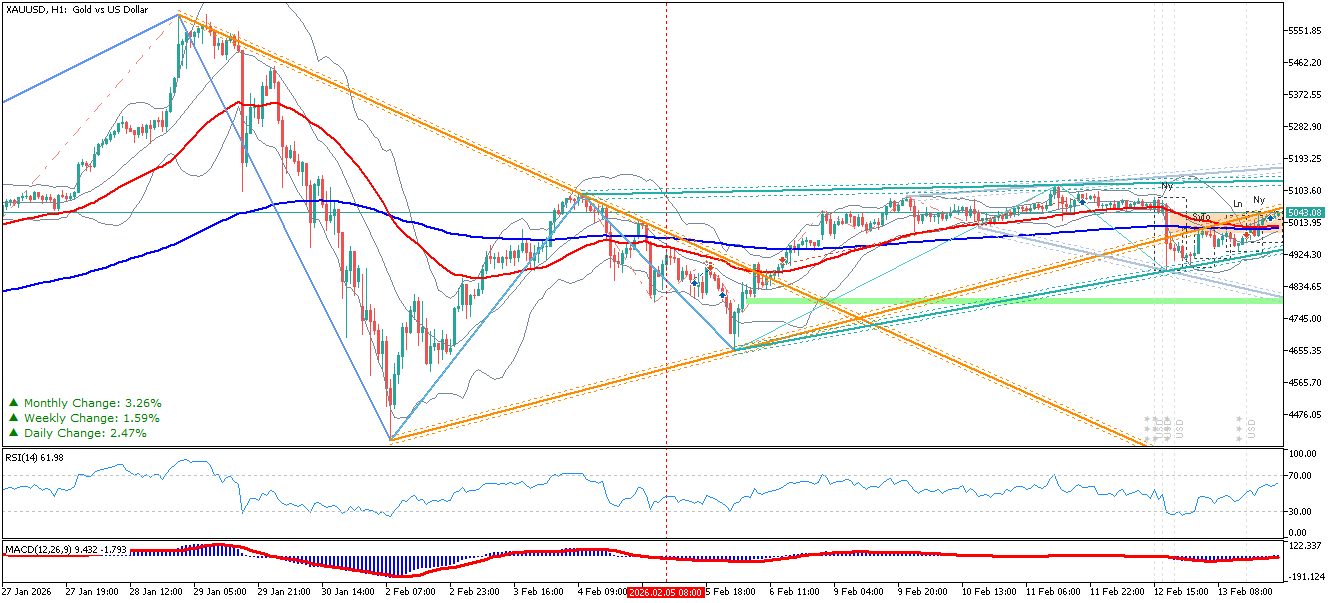
Gold is currently trading near the upper region of its bullish structure, moving inside a rising channel. The RSI(14) at 61.98 shows strong buying pressure, while the MACD(12,26,9) values (9.432 and -1.793) indicate positive but slightly slowing momentum. Price action remains supported by multiple ascending trendlines.
EMA Structure and Bollinger Behavior
Price is positioned above the EMA 50 (red) and well above the EMA 200 (blue), confirming a strong bullish trend. The Bollinger Bands (green) are expanding, signaling increased volatility and continuation potential. The grey trendlines beneath price reinforce the higher‑low structure.
Support, Resistance, and Scenarios
The nearest resistance lies at the upper boundary of the rising channel. A breakout above this zone could trigger a continuation toward new highs. On the downside, the first support sits at the mid‑channel trendline, followed by the EMA 50 and the lower Bollinger band. Losing these supports may shift momentum into a corrective pullback.
Trading Outlook
As long as price remains above the EMA 200 and inside the rising channel, the dominant scenario favors bullish continuation. Pullbacks toward the EMA 50 or mid‑channel support may offer low‑risk buying opportunities.
Technical Analysis of Bitcoin (BTC/USD) – H1 Timeframe – February 13, 2026
Analysis:
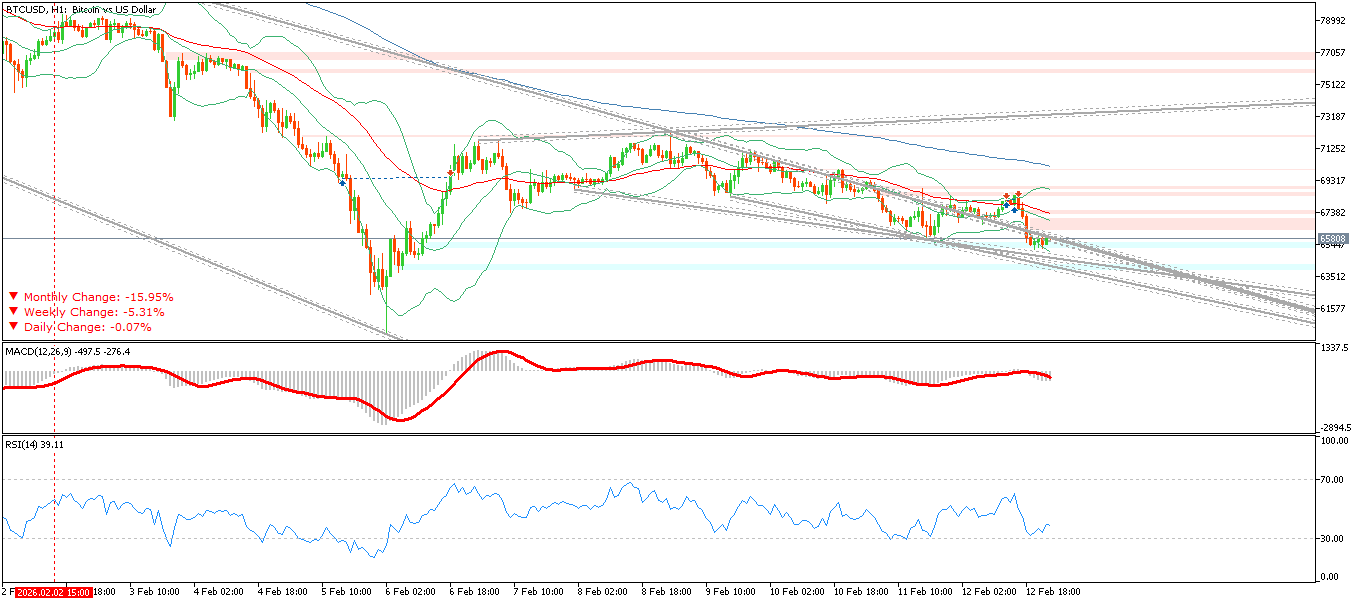
Bitcoin is trading around 65,808 USD and remains inside a descending channel. The RSI(14) at 39.11 reflects weak buying pressure and potential oversold conditions. The MACD remains negative, confirming bearish momentum. Price continues to react to red resistance zones above and blue support zones below.
EMA Structure and Trend Channel
Price is positioned below the EMA 50 (red) and near or below the EMA 200 (blue), confirming short‑term bearish dominance. The Bollinger Bands show moderate volatility, with price repeatedly rejecting the middle band. The grey trendlines outline a clear descending channel with lower highs and lower lows.
Support, Resistance, and Scenarios
The red resistance zones above price have repeatedly rejected bullish attempts. A confirmed breakout above these zones and above the EMA 200 would signal a potential trend reversal. On the downside, the blue support zones remain critical; losing them could extend the bearish continuation inside the channel.
Trading Outlook
As long as price stays below the EMA 50 and within the descending channel, the bearish scenario remains dominant. Short opportunities may appear near channel resistance, while a breakout above the upper boundary could shift momentum toward a bullish recovery.
Technical Analysis of Bitcoin (BTC/USD) – H1 Timeframe – February 13, 2026
Analysis:
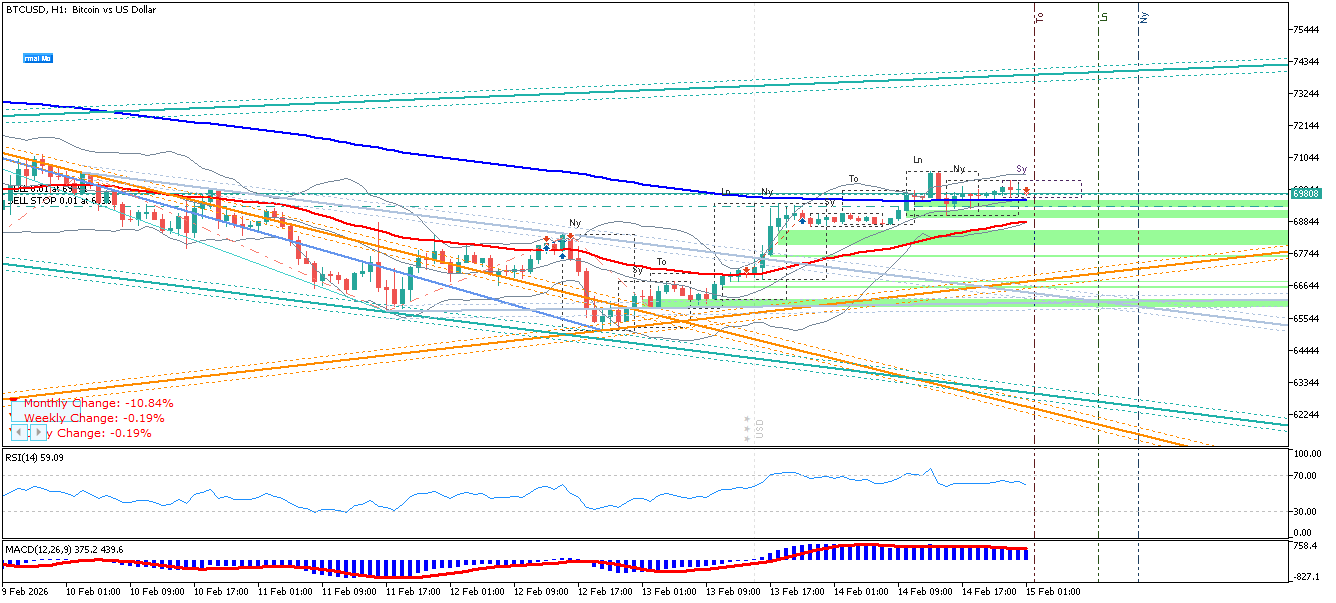
This BTC/USD chart shows a stronger bullish recovery phase. Price is climbing inside a rising structure, supported by a strong RSI(14) at 59.09 and a highly positive MACD reading (3752.4396), indicating strong upward momentum. A SELL STOP 0.01 label appears below current price, suggesting a breakout‑based strategy.
EMA Structure and Trend Behavior
Price is positioned above both the EMA 50 (red) and EMA 200 (blue), confirming a bullish environment. The Bollinger Bands are widening, showing increased volatility and continuation potential. Trendlines indicate a rising channel with higher highs and higher lows.
Support, Resistance, and Scenarios
The nearest resistance lies at the upper channel boundary. A breakout above this level could extend the bullish rally. On the downside, the EMA 50 and lower trendline form the first support zone. A break below these levels may trigger a deeper correction toward the EMA 200.
Trading Outlook
With strong MACD momentum and RSI near bullish territory, the dominant scenario favors continuation to the upside. Pullbacks toward the EMA 50 may offer buying opportunities, while sellers may only gain control if price breaks below the lower channel boundary.
Written & researched by Dr. Shahin Siami