
~4 min read • Updated Feb 12, 2026
Technical Analysis of Gold (XAU/USD) – H1 Timeframe – February 11, 2026
Analysis:
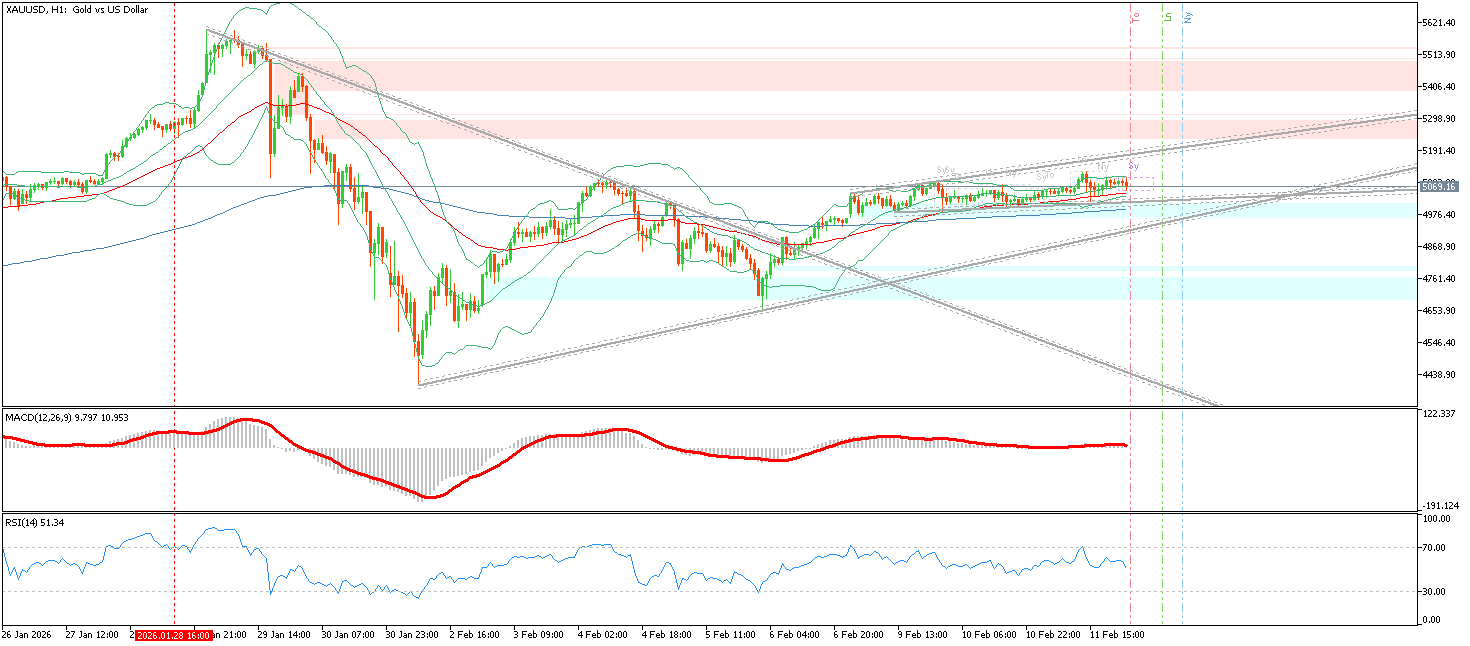
On the 1-hour chart of XAU/USD, the price is positioned around 5083.16 USD. The market is consolidating near the middle of the Bollinger Bands, indicating a pause within a broader bullish structure. The MACD values (9.797 and 10.953) remain in positive territory, while the RSI(14) sits near 51.34, reflecting neutral-to-bullish momentum.
EMA Structure and Bollinger Position
Price is hovering slightly above the EMA 50 (red), while maintaining a healthy distance above the EMA 200 (blue). This alignment confirms a medium-term bullish trend. The interaction with the middle Bollinger band suggests compression and potential buildup for the next directional move.
Key Supports, Resistances, and Scenarios
The nearest resistance is the recent swing high where multiple candles have rejected. A clean breakout above this zone could open the path toward higher highs. On the downside, a strong support cluster exists where the EMA 50, the middle Bollinger band, and an ascending grey trendline overlap. Losing this support may trigger a deeper pullback toward the EMA 200.
Trading Outlook
As long as price remains above the EMA 200, the dominant scenario favors continuation of the broader uptrend. Short-term traders may look for bullish confirmation above resistance, while a break below the EMA 50 could shift momentum toward a corrective phase.
Technical Analysis of Bitcoin (BTC/USD) – H1 Timeframe – February 11, 2026
Analysis:
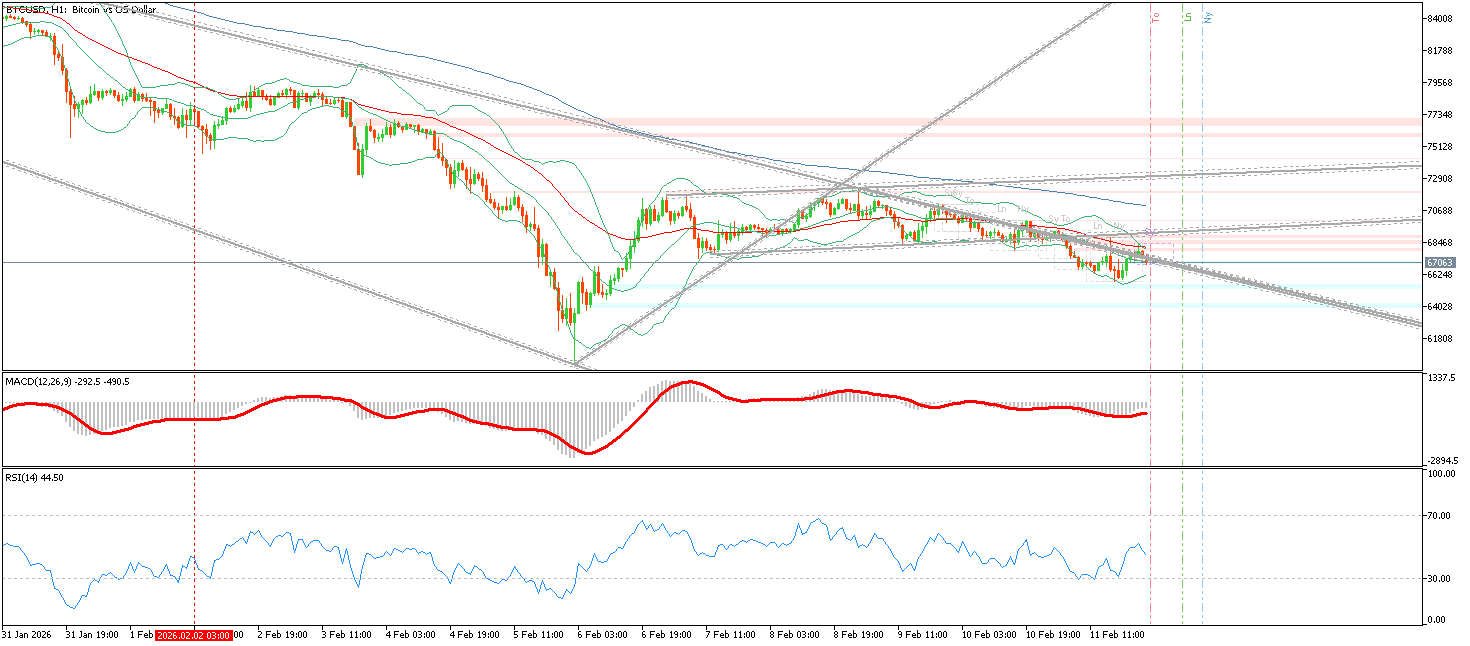
On the 1-hour chart of BTC/USD, price is moving inside a descending channel and remains below major red resistance zones. The Bollinger Bands show moderate volatility. The MACD values (-292.5 and -490.5) are clearly negative, and the RSI(14) at 44.50 reflects weak bullish pressure and prevailing bearish momentum.
EMA Structure and Trend Channel
Price is trading below the EMA 50 (red) and often below or near the EMA 200 (blue), confirming bearish dominance in the short-term structure. The grey trendlines outline a descending channel with consistent lower highs and lower lows.
Key Supports, Resistances, and Scenarios
The red resistance zones above price have repeatedly rejected bullish attempts. A confirmed breakout above these zones and above the EMA 200 would be the first sign of a trend shift. On the downside, the blue/green support areas remain critical; losing them could extend the bearish leg within the channel.
Trading Outlook
As long as price stays below the EMA 50 and inside the descending channel, the dominant scenario remains bearish. Traders may consider short setups near channel resistance, while a breakout above the upper boundary could signal a potential reversal.
Technical Analysis of EUR/USD – H1 Timeframe – February 11, 2026
Analysis:
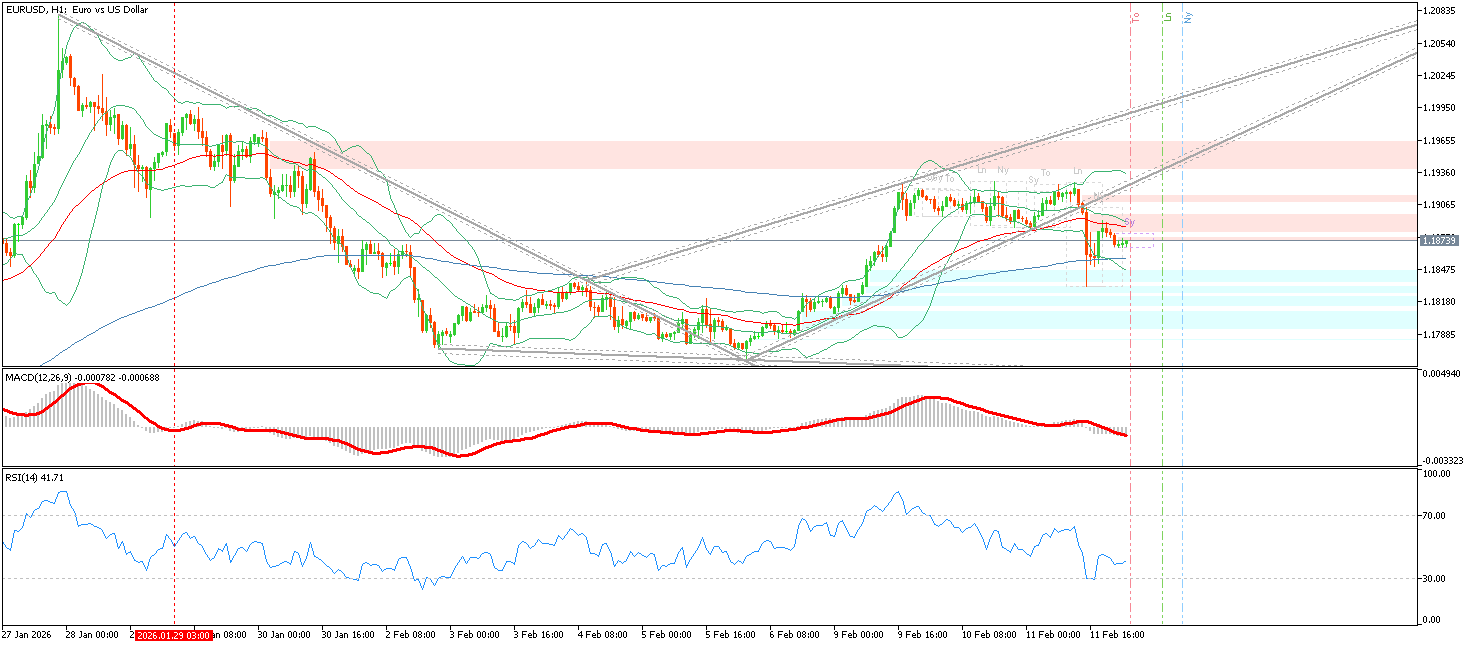
The 1-hour chart of EUR/USD shows price moving within a corrective bearish structure. The Bollinger Bands indicate mild volatility with a downward bias. The MACD values (-0.000782 and -0.000688) remain slightly negative, and the RSI(14) at 41.71 signals weak buying pressure and bearish momentum.
EMA Structure and Trend Formation
Price is trading below the EMA 50 (red) and near or below the EMA 200 (blue), confirming a bearish environment. The grey trendlines form a descending channel or wedge, with consistent lower highs and lower lows. Reactions at the middle Bollinger band and EMA 50 have repeatedly pushed price downward.
Key Supports, Resistances, and Scenarios
Resistance zones above price align with the descending trendline, making them strong barriers. A breakout above these levels and above the EMA 200 would be the first sign of weakening bearish pressure. Support lies at recent lows; breaking these levels could trigger a new bearish wave.
Trading Outlook
As long as price remains below both EMA 50 and EMA 200, and with MACD and RSI showing weakness, the dominant scenario favors continued bearish movement. Traders may look for short opportunities near resistance, while a confirmed breakout above the descending channel could shift the outlook toward neutral or bullish.
Written & researched by Dr. Shahin Siami