
~4 min read • Updated Feb 15, 2026
Technical Analysis of Gold (XAU/USD) – H1 Timeframe – February 12, 2026
Analysis:
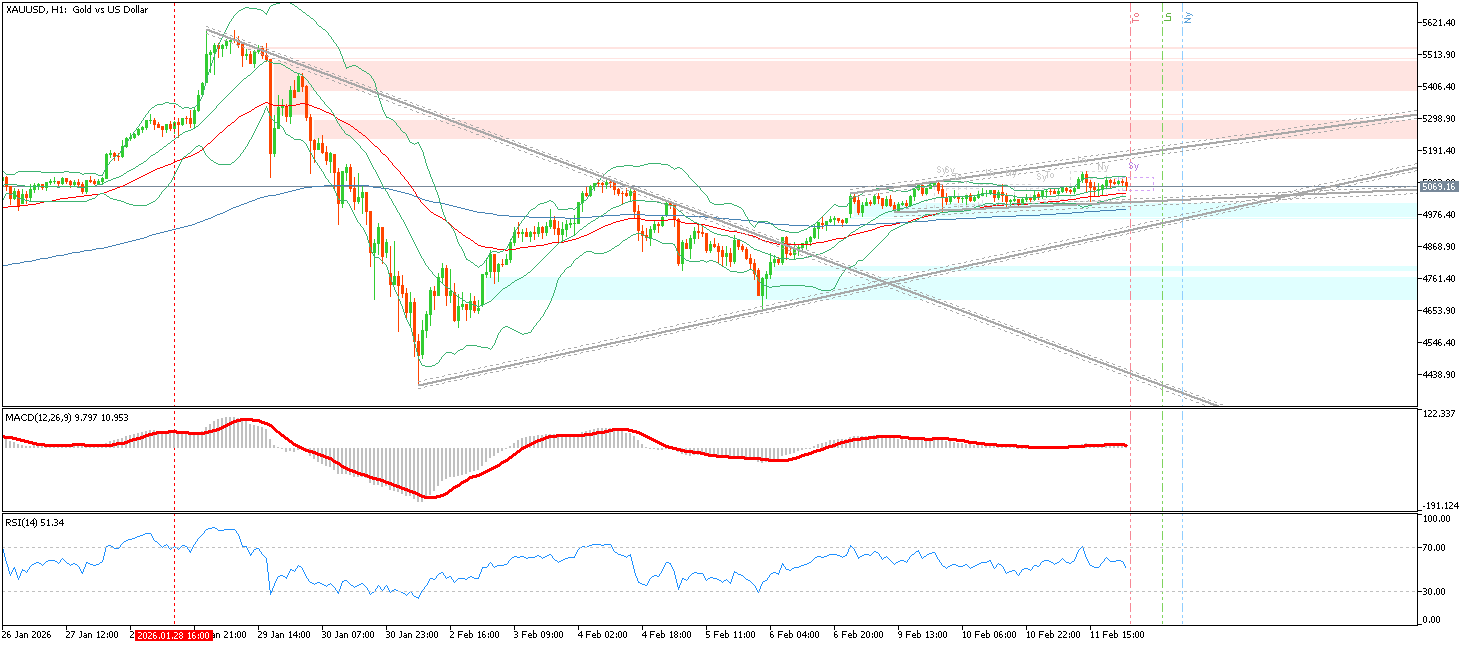
Gold is trading around 5083.16 USD, moving near the middle of the Bollinger Bands. The overall structure remains bullish, supported by positive MACD readings (9.797 and 10.953) and a neutral-to-slightly bullish RSI(14) around 51.34.
EMA Structure and Trend Behavior
Price is positioned above the EMA 50 (red) and well above the EMA 200 (blue), confirming a medium-term bullish trend. The ascending grey trendline continues to support higher lows, while the middle Bollinger band acts as dynamic support.
Support, Resistance, and Scenarios
The nearest resistance is the recent swing high where multiple candles have rejected. A breakout above this level may open the path toward new highs. On the downside, a strong support cluster exists at the confluence of the EMA 50, the middle Bollinger band, and the ascending trendline. Losing this zone could trigger a deeper pullback toward the EMA 200.
Trading Outlook
As long as price remains above the EMA 200, the dominant scenario favors continuation of the uptrend. Buyers may wait for a breakout above resistance, while sellers gain control only if price breaks below the EMA 50 and the trendline support.
Technical Analysis of Bitcoin (BTC/USD) – H1 Timeframe – February 12, 2026
Analysis:
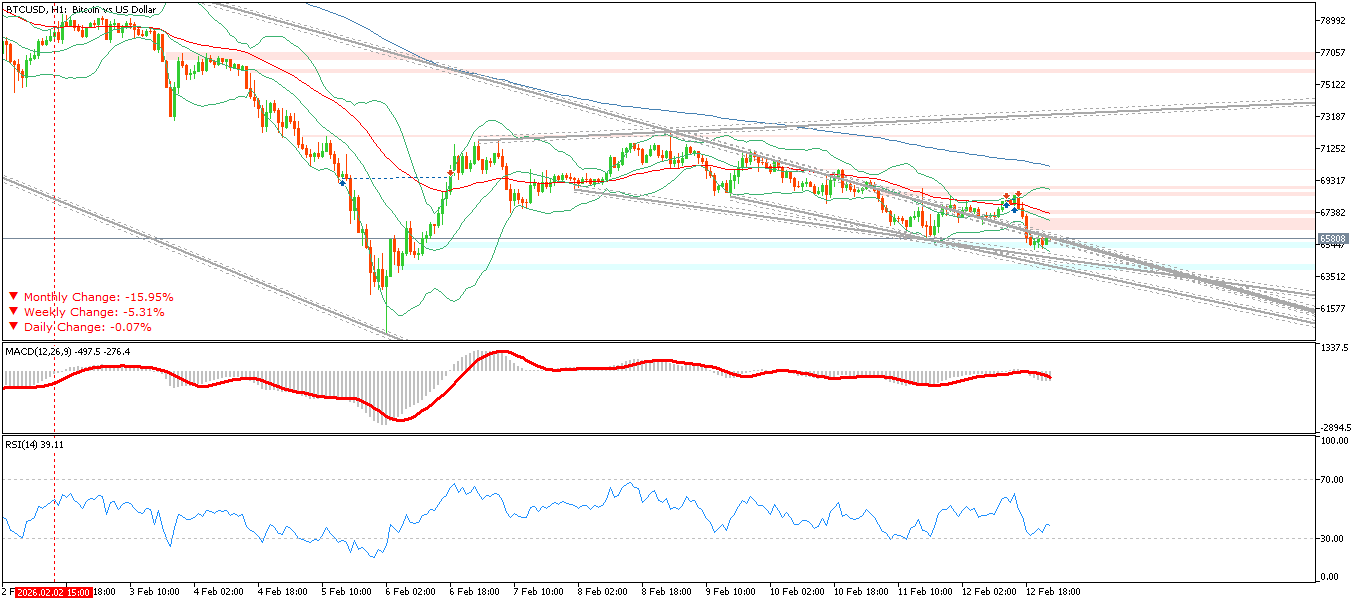
Bitcoin is trading near 65,808 USD, moving inside a descending channel and staying below major red resistance zones. The Bollinger Bands show moderate volatility. The MACD remains negative, and the RSI(14) around 44.50 reflects weak bullish pressure and dominant bearish momentum.
EMA Structure and Trend Channel
Price is positioned below the EMA 50 (red) and near or below the EMA 200 (blue), confirming short-term bearish control. The grey trendlines outline a clear descending channel with lower highs and lower lows.
Support, Resistance, and Scenarios
The red resistance zones above price have repeatedly rejected bullish attempts. A confirmed breakout above these zones and above the EMA 200 would signal a potential trend reversal. On the downside, the blue support zones remain critical; losing them could extend the bearish continuation inside the channel.
Trading Outlook
As long as price stays below the EMA 50 and within the descending channel, the bearish scenario remains dominant. Short opportunities may appear near channel resistance, while a breakout above the upper boundary could shift momentum toward a bullish recovery.
Technical Analysis of EUR/USD – H1 Timeframe – February 12, 2026
Analysis:
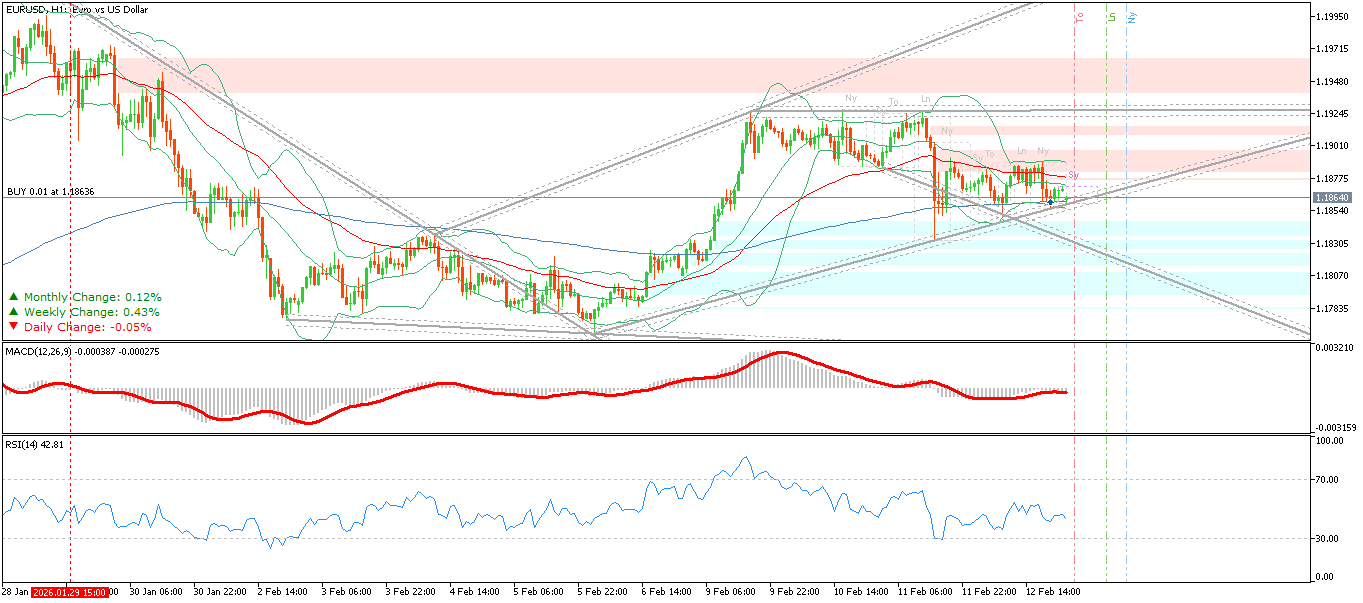
EUR/USD is moving within a bearish corrective structure. A trade labeled BUY 0.01 at 1.18636 appears on the chart near the current market zone. The MACD values (-0.000387 and -0.000275) remain slightly negative, and the RSI(14) at 42.81 signals weak buying pressure and bearish momentum.
EMA Structure and Trend Behavior
Price is positioned below the EMA 50 (red) and near or below the EMA 200 (blue), confirming a bearish environment. The grey trendlines form a descending channel with consistent lower highs and lower lows. Reactions at the middle Bollinger band and EMA 50 have repeatedly pushed price downward.
Support, Resistance, and Scenarios
Resistance zones above price align with the descending trendline, making them strong barriers. A breakout above these levels and above the EMA 200 would be the first sign of weakening bearish pressure. Support lies at recent lows; breaking these levels could trigger a new bearish wave.
Trading Outlook
As long as price remains below both the EMA 50 and EMA 200, and with MACD and RSI showing weakness, the dominant scenario favors continued bearish movement. Short opportunities may appear near resistance, while a confirmed breakout above the descending channel could shift the outlook toward neutral or bullish.
Written & researched by Dr. Shahin Siami